
🗐
Learn how Aegisify Audit works, what it reviews, how data is handled, and the security, privacy, and technical evidence behind the platform.
Evaluate the platform with evidence, not guesswork.
Explore the facts behind Aegisify and see how its WordPress security audit and risk intelligence platform turns technical evidence into clearer, informed action for security inspectors, WordPress professionals, marketers, security leaders, and executives.
See how technical findings become practical WordPress risk intelligence.
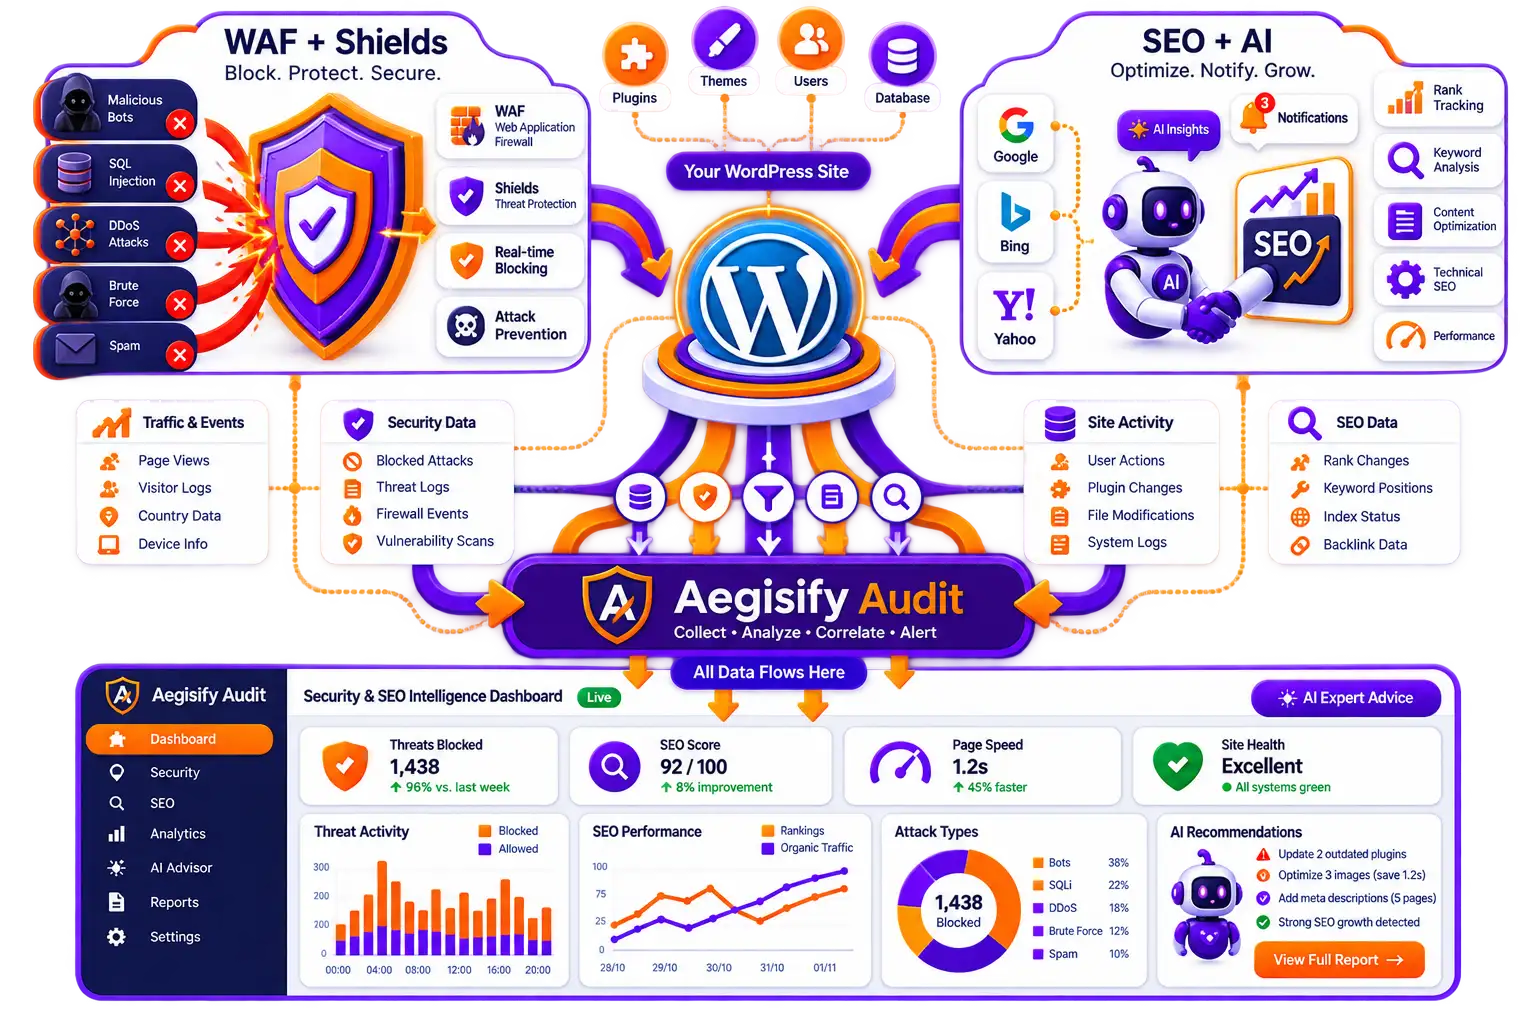
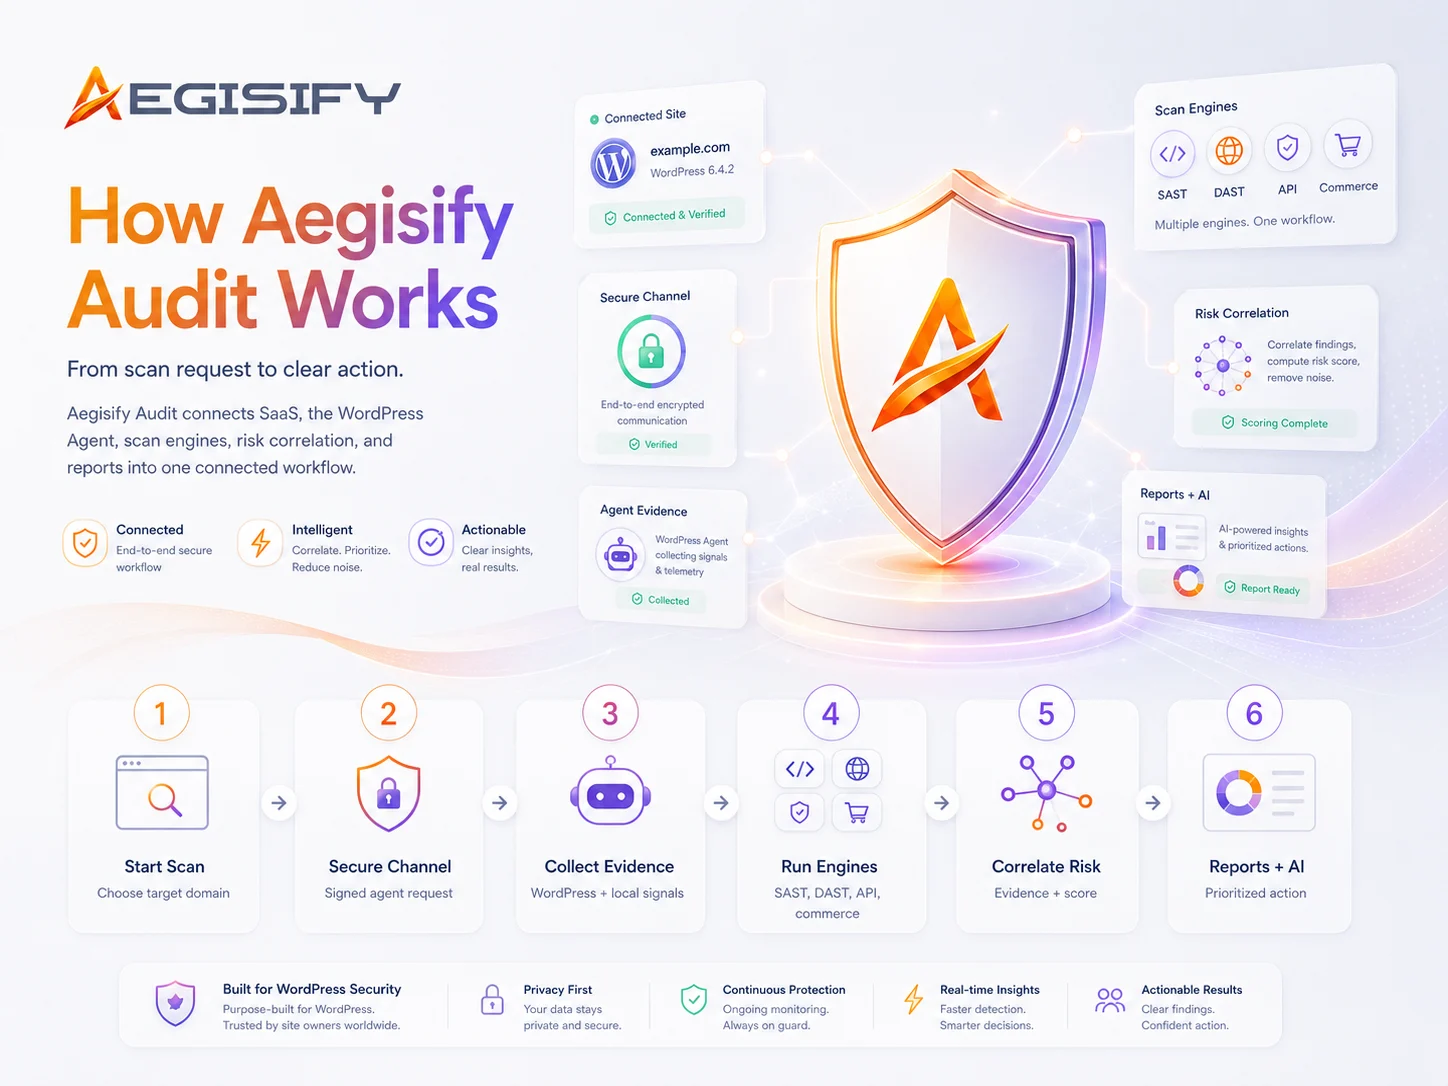
The Aegisify Facts & Proof Center explains how external scanning and the customer-authorized WordPress Agent work together across SAST-style code analysis, DAST-style exposure checks, plugin and theme intelligence, dependencies, configuration, APIs, activity events, optional logs, and AI-assisted risk prioritization.
It also explains how sanitized WordPress security audit reports connect findings with evidence, severity, potential business impact, remediation priorities, and retesting so buyers can understand the assessment process before placing trust in the platform.


Review the top findings, validate evidence, assign owners, fix high-priority issues, document changes, retest, and monitor for drift or recurrence.
AI assists with summarization, prioritization, drift analysis, alert logic, and remediation guidance. AI output should be reviewed by a human before changes are made.
No. Cloudflare WAF protects traffic at the edge. Aegisify Audit adds WordPress-specific audit evidence that an edge WAF cannot fully see, such as plugins, themes, code, dependencies, local routes, logs, file drift, and WooCommerce signals.
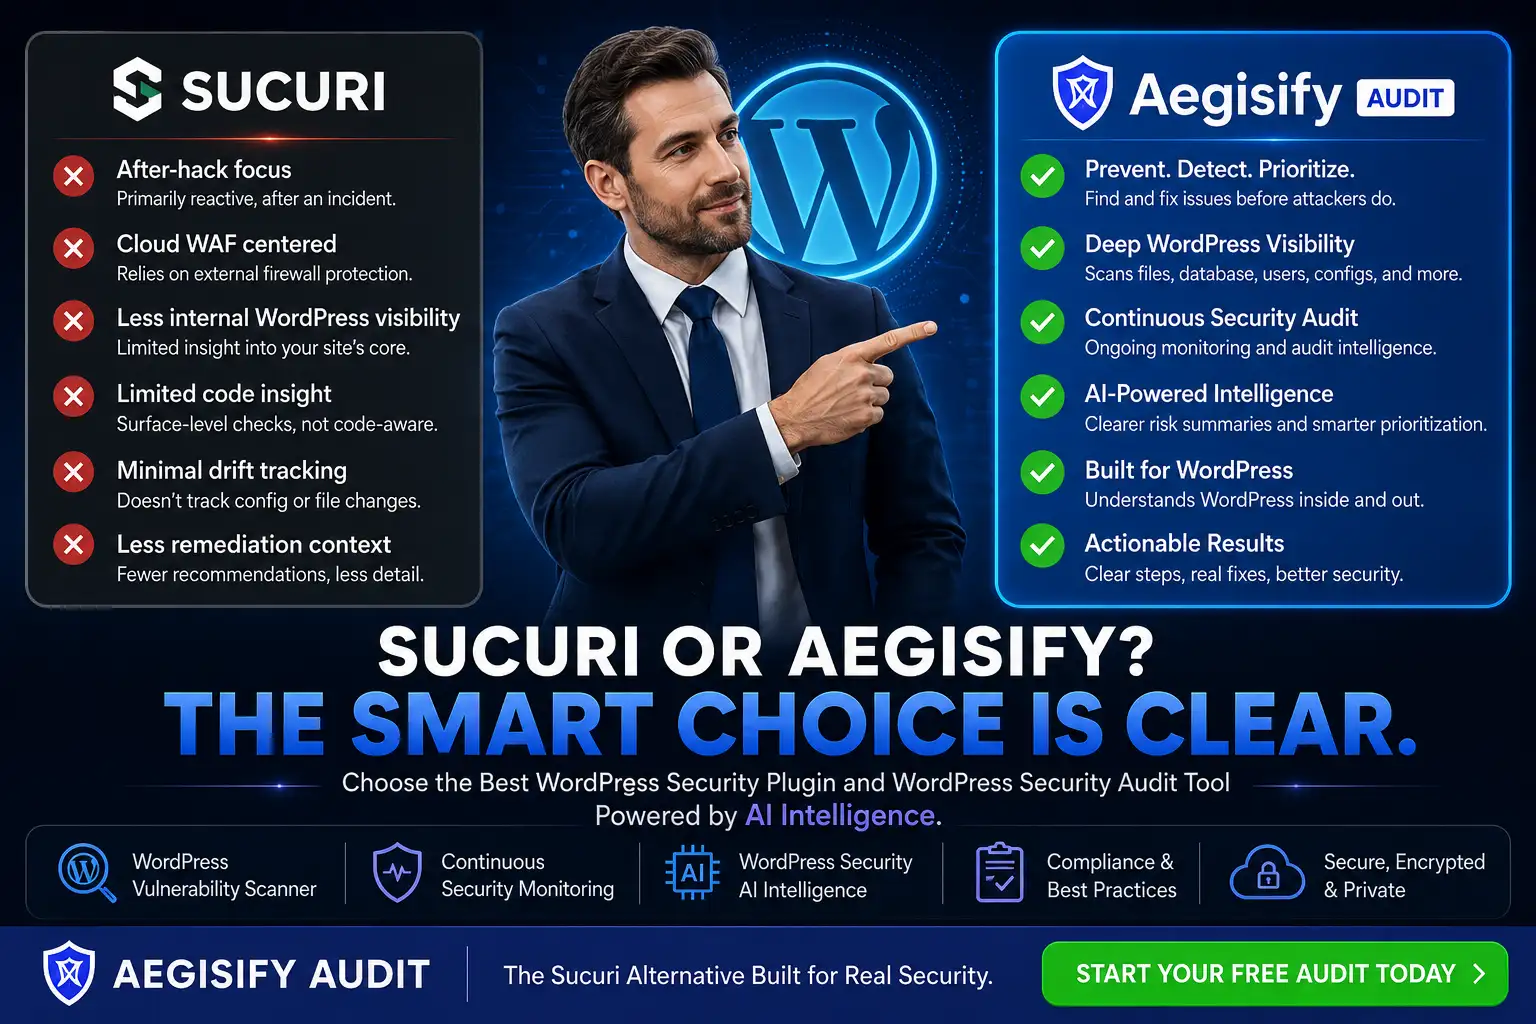
Not necessarily. Sucuri is commonly associated with cloud WAF, malware removal, monitoring, and cleanup services. Aegisify Audit focuses on verified-domain audit intelligence and local WordPress evidence.
Not necessarily. Patchstack is known for vulnerability intelligence and virtual patching. Aegisify Audit connects vulnerability signals to a broader WordPress audit workflow with Agent evidence, DAST, WooCommerce review, logs, and remediation tracking.
Not necessarily. Wordfence is commonly used for endpoint firewall, malware scanning, login security, and threat intelligence. Aegisify Audit is positioned around audit intelligence, Agent evidence, DAST/API discovery, reports, and remediation workflow. Some teams may use both.
No. No security scanner can guarantee complete security. Aegisify Audit helps identify, prioritize, and track risk, but security also depends on hosting, patching, access control, secure development, backups, monitoring, and human review.
The Agent is designed around metadata-only telemetry controls for SaaS synchronization. The intended model is to avoid sending post bodies, comments, order contents, usernames, emails, secrets, tokens, API keys, and raw database row content. Customers should review telemetry settings before enabling data sharing.
The Agent includes Deep Code Analysis using bundled PHPCS/WPCS and Aegisify custom sniffs where the host runtime supports the required execution environment.
Yes. Aegisify Audit includes WooCommerce-oriented review categories such as checkout, Store API, payments, payment integrity, webhooks, HPOS, privacy, template overrides, extension scoring, and action scheduler risk categories.
DAST stands for dynamic application security testing. It reviews a live site from the outside to identify exposure and risk indicators such as headers, cookies, redirects, forms, APIs, front-end scripts, and session/auth signals.
Aegisify Audit should be used only for domains you own or are authorized to test. Public copy should always reinforce authorized, verified-domain scanning.
The Agent can collect approved local WordPress metadata such as inventory, plugin/theme details, roles, runtime posture, REST routes, admin-ajax actions, dependency manifests, file drift, hardening checks, permissions, static code findings, and activity signals.
Aegisify Audit is for WordPress site owners, agencies, developers, WooCommerce operators, security-conscious founders, and organizations running mission-critical WordPress sites.
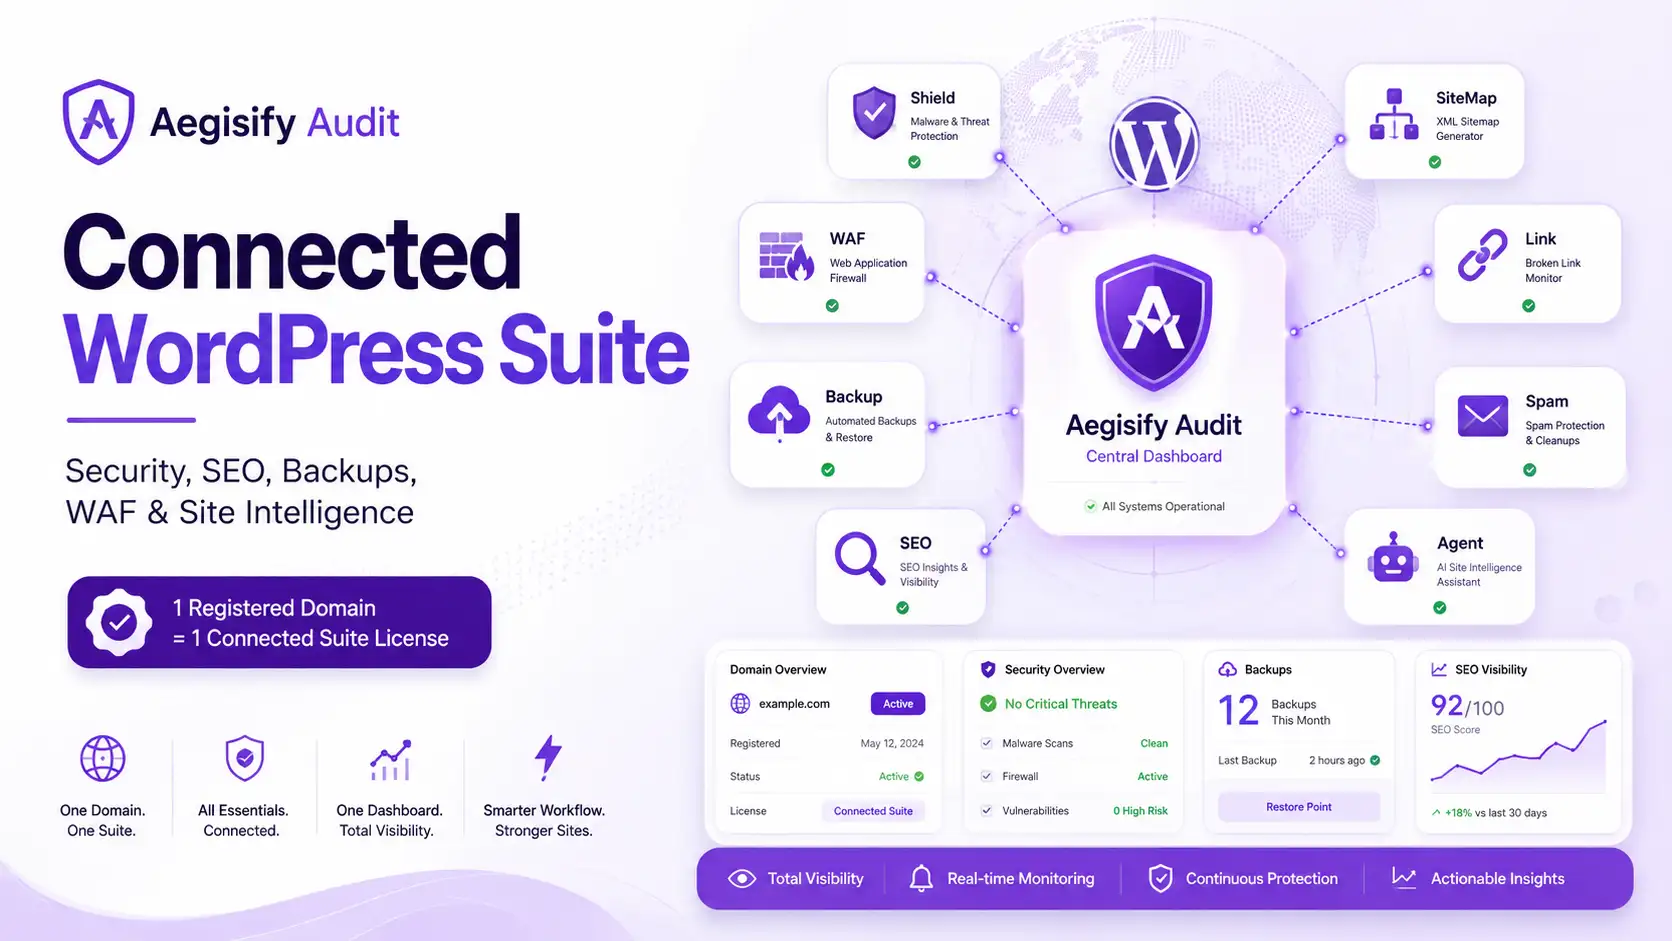
Aegisify Audit is best described as a SaaS-backed audit platform paired with a WordPress Agent. The Agent adds local WordPress evidence to the SaaS audit workflow.
Aegisify Audit is a WordPress security audit and site-intelligence platform for verified domains. It combines SaaS-based scanning, WordPress Agent evidence, DAST, API discovery, WooCommerce risk review, vulnerability and dependency signals, logs, reports, and AI-assisted remediation guidance.
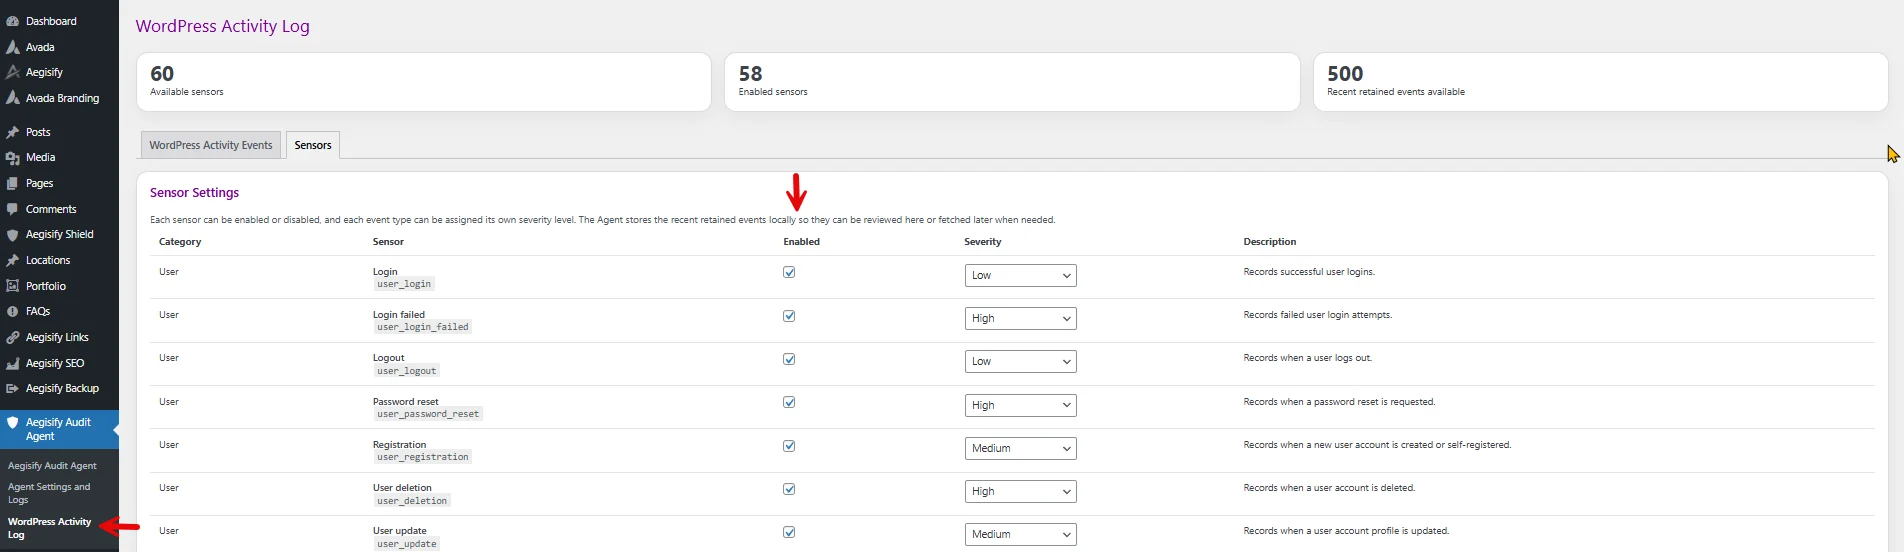
You will need to turn on WordPress Sensors for Aegisify Audit to be able to fetch, ingest and analyze your site for you.
1st Step
Go to your wordpress wp-admin -> Aegisify Audit Agent -> WordPress Activity Log
– Enable all the sensors you want from your wordpress application and website.
– You can specify the Severity or keep it default
2nd Step
You will need to allow Aegisify Audit access to fetch the logs.
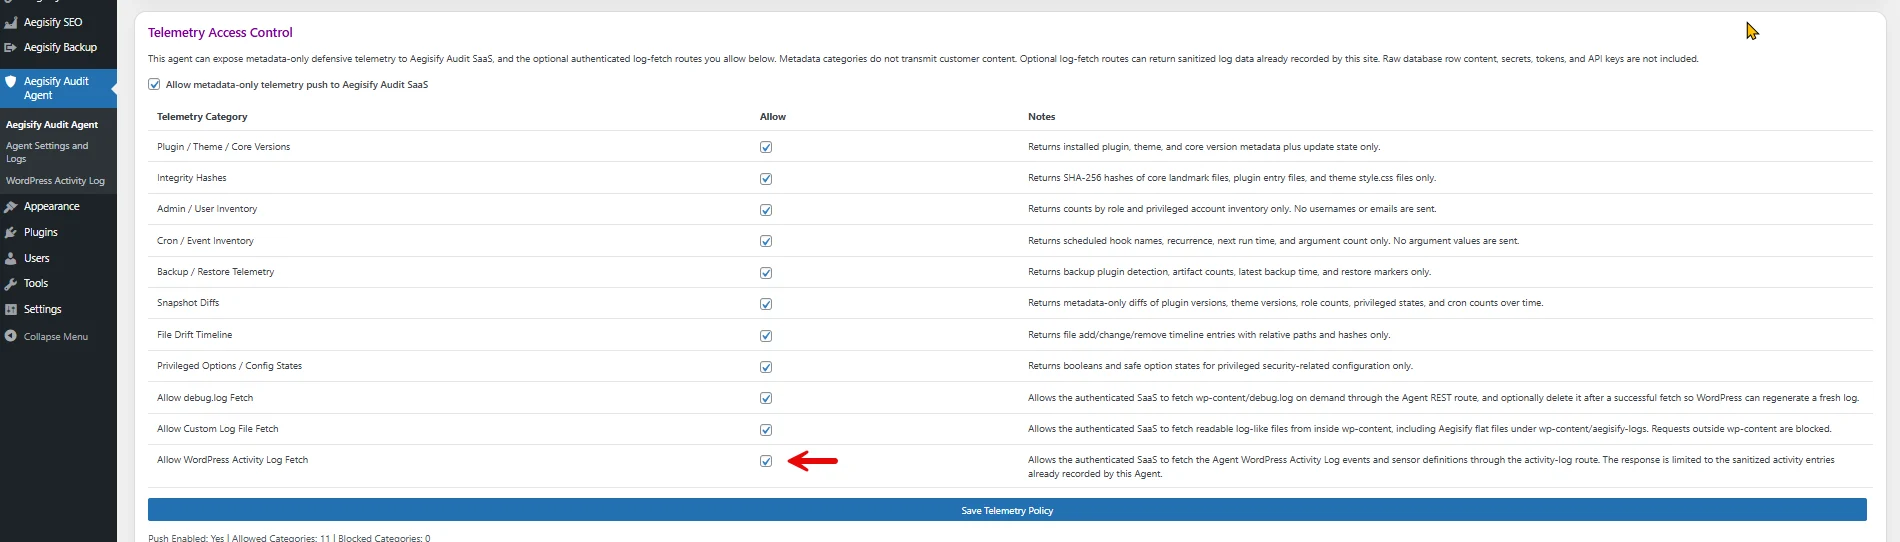
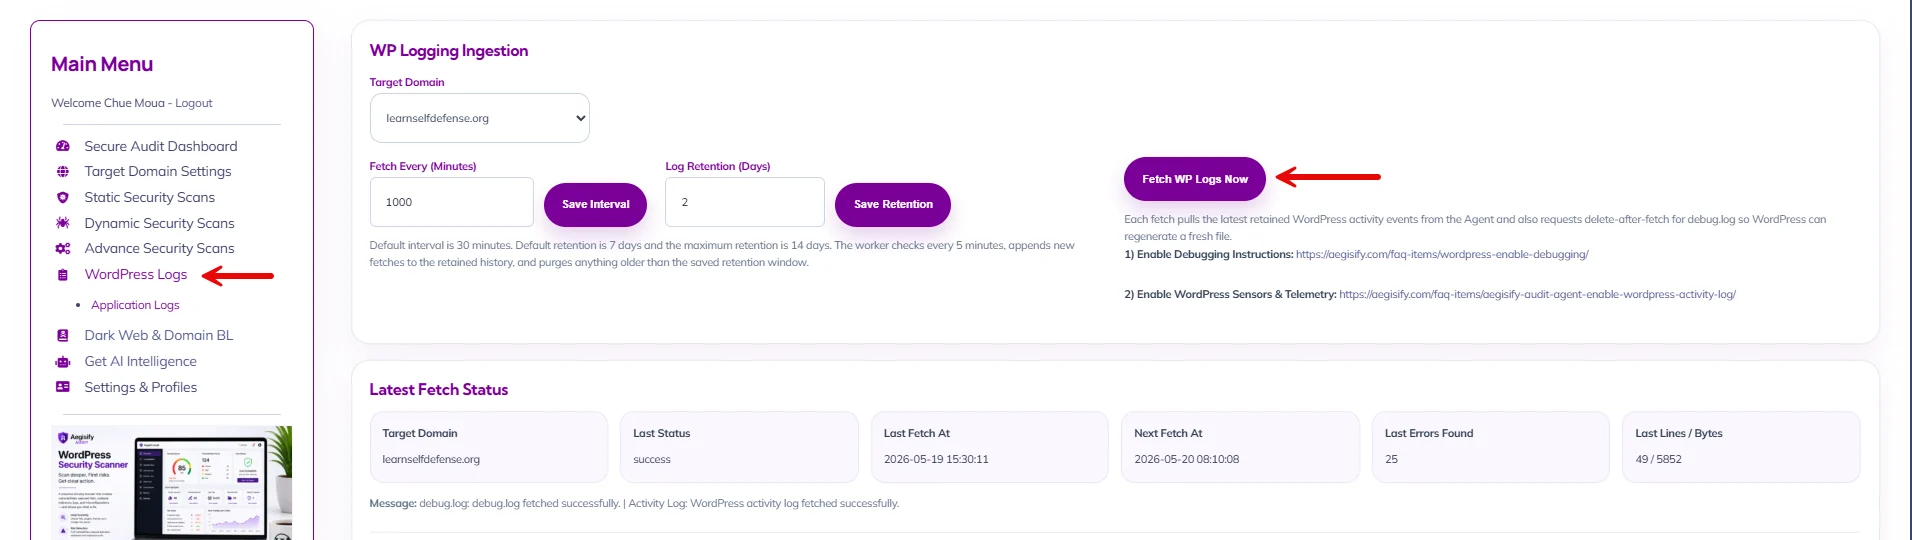
From Aegisify Audit Dashboard: how to access and fetch the logs
Log into the Aegisify Dashboard and click Fetch WP Logs Now to fetch all logs.
How to Enable Debugging in WordPress for Aegisify
WordPress includes built-in debugging tools that can capture PHP errors, warnings, notices, plugin conflicts, and other technical issues. Aegisify Audit can retrieve this debugging information through the Aegisify Audit Agent, but WordPress, the Agent, and Aegisify Audit SaaS must all reference the same debug log file.
Instead of using the default /wp-content/debug.log, Aegisify supports a custom log location such as:
/wp-content/path/to/file/file-dweih32afhi325oho23.txt
Using a custom filename also makes the debugging file less predictable than the standard debug.log filename.
Before You Begin
Before editing wp-config.php, create a recent backup of the website or make the change in a staging environment when possible.
You will configure the debug location in three places:
WordPress
wp-config.phpAegisify Audit Agent
Aegisify Audit SaaS
The path configured in all three locations must identify the same file.
For this example, we will use:
/wp-content/path/to/file/file-dweih32afhi325oho23.txt
Step 1: Access Your WordPress Files
Access the WordPress installation using one of the following:
FTP or SFTP
Your hosting provider’s file manager
cPanel
Plesk
Another server-management interface provided by your host
Open the root directory of the WordPress installation and locate:
wp-config.php
Step 2: Configure the Custom Debug Log in wp-config.php
Open wp-config.php and look for an existing WordPress debugging configuration.
You may find:
define( 'WP_DEBUG', false );
Replace the existing debugging configuration, or add the new configuration before:
/* That's all, stop editing! Happy blogging. */
Use:
define( 'WP_DEBUG', true );

define(
    'WP_DEBUG_LOG',
    __DIR__ . '/wp-content/path/to/file/file-dweih32afhi325oho23.txt'
);

define( 'WP_DEBUG_DISPLAY', true );

@ini_set( 'display_errors', 0 );
WordPress supports setting WP_DEBUG_LOG to a valid file path instead of only setting it to true. This causes WordPress debugging output to be written to the specified file rather than the standard /wp-content/debug.log.
In this example, the physical log file is:
<WordPress installation>/wp-content/path/to/file/file-dweih32afhi325oho23.txt
The corresponding portable path that will be entered into Aegisify Audit and the Aegisify Audit Agent is:
/wp-content/path/to/file/file-dweih32afhi325oho23.txt
Do not enter __DIR__ into Aegisify Audit or the Agent. __DIR__ is PHP syntax used inside wp-config.php. Aegisify uses the WordPress-content-relative path beginning with /wp-content/.
Step 3: Save wp-config.php
Save the updated wp-config.php file.
If you are using FTP or SFTP, upload the modified file back to the WordPress installation.
The custom directory must exist and the WordPress/PHP process must be able to write the configured log file.
Your WordPress configuration should now point debugging to:
/wp-content/path/to/file/file-dweih32afhi325oho23.txt
Step 4: Configure the Same Path in Aegisify Audit Agent
In WordPress Administration, go to:
Aegisify Audit Agent → Agent Settings and Logs → WordPress Debug
Locate:
Location of Debug Log
Enter exactly:
/wp-content/path/to/file/file-dweih32afhi325oho23.txt
Save the location.
The Agent path must match the file configured in wp-config.php.
After saving, the Protected Debug Log Viewer should read debugging information from that configured file.
If wp-config.php contains:
__DIR__ . '/wp-content/path/to/file/file-dweih32afhi325oho23.txt'
the Agent must contain:
/wp-content/path/to/file/file-dweih32afhi325oho23.txt
Step 5: Configure the Same Path in Aegisify Audit SaaS
Log in to Aegisify Audit and open the WordPress logging page for the appropriate Target Domain.
Under:
Debugging
locate:
Location of Debug Log
Enter exactly:
/wp-content/path/to/file/file-dweih32afhi325oho23.txt
Save the location.
The SaaS configuration and Agent configuration must be identical.
Correct:
WordPress:
__DIR__ . '/wp-content/path/to/file/file-dweih32afhi325oho23.txt'

Aegisify Audit Agent:
/wp-content/path/to/file/file-dweih32afhi325oho23.txt

Aegisify Audit SaaS:
/wp-content/path/to/file/file-dweih32afhi325oho23.txt
Incorrect:
Agent:
/wp-content/debug.log

SaaS:
/wp-content/path/to/file/file-dweih32afhi325oho23.txt
Aegisify intentionally requires the Agent and SaaS Debugging locations to agree so that a request cannot silently retrieve debugging information from a different file than the one configured for the site.
Step 6: Reproduce the Problem
Return to the WordPress site and repeat the action that generated the issue.
Examples include:
Reloading the page that produced an error
Submitting a form again
Running the plugin feature that failed
Repeating an administrative action
Running a scheduled task
Reproducing an AJAX or REST API failure
WordPress can record errors generated during requests that are not directly visible in the browser, which is one of the primary uses of WP_DEBUG_LOG.
Step 7: Verify the Protected Debug Log Viewer
Return to:
WordPress Admin → Aegisify Audit Agent → Agent Settings and Logs → WordPress Debug
Under:
Protected Debug Log Viewer
verify that entries from the custom file are displayed.
The Agent should now be reading:
/wp-content/path/to/file/file-dweih32afhi325oho23.txt
instead of assuming:
/wp-content/debug.log
If the expected entries do not appear, first verify that the path saved in the Agent is identical to the path configured in wp-config.php.
Step 8: Fetch the Debugging Log into Aegisify Audit
In Aegisify Audit, select the correct Target Domain and verify that Location of Debug Log is:
/wp-content/path/to/file/file-dweih32afhi325oho23.txt
Then click:
Fetch WP Logs Now
The expected flow is:
WordPress
   ↓
Custom Debug File
   ↓
Aegisify Audit Agent
   ↓
Authenticated Aegisify Communication
   ↓
Aegisify Audit SaaS
   ↓
Debugging Ingestion and Analysis
The Agent retrieves the configured file and Aegisify Audit ingests the returned debugging information.
For this process to succeed, these locations must match:
wp-config.php:
__DIR__ . '/wp-content/path/to/file/file-dweih32afhi325oho23.txt'

Agent:
 /wp-content/path/to/file/file-dweih32afhi325oho23.txt

SaaS:
 /wp-content/path/to/file/file-dweih32afhi325oho23.txt
If the Agent and SaaS paths do not match, correct the configuration before fetching again.
Step 9: Review the Latest Debugging Information
After the fetch completes, Aegisify Audit displays the retained Debugging information associated with the selected Target Domain.
Use the latest entries to investigate:
PHP errors
PHP warnings
PHP notices
Plugin failures
Theme failures
Background-processing errors
REST or AJAX problems
Scheduled-task failures
Other WordPress application errors captured by the configured debug log
The physical debugging file remains on the WordPress server while Aegisify uses its authenticated Agent communication to retrieve the authorized debugging information.
Step 10: Turn Debugging Off When It Is No Longer Required
WordPress recommends debugging features primarily for development and troubleshooting rather than leaving them unnecessarily enabled on a production website.
When troubleshooting is complete, change:
define( 'WP_DEBUG', true );
to:
define( 'WP_DEBUG', false );
You can leave the custom file path documented so it is available the next time debugging is intentionally enabled.
Recommended Aegisify Debug Configuration
WordPress wp-config.php:
define( 'WP_DEBUG', true );

define(
    'WP_DEBUG_LOG',
    __DIR__ . '/wp-content/path/to/file/file-dweih32afhi325oho23.txt'
);

define( 'WP_DEBUG_DISPLAY', true );

@ini_set( 'display_errors', 0 );
Aegisify Audit Agent:
/wp-content/path/to/file/file-dweih32afhi325oho23.txt
Aegisify Audit SaaS:
/wp-content/path/to/file/file-dweih32afhi325oho23.txt
The important rule is:
The custom Debugging file configured in wp-config.php, Aegisify Audit Agent, and Aegisify Audit SaaS must all reference the same WordPress debug file.
Important Note About Displaying Errors
The configuration above uses:
define( 'WP_DEBUG_DISPLAY', true );
With WP_DEBUG_DISPLAY enabled, WordPress may display debugging messages in applicable page output. WordPress documents WP_DEBUG_DISPLAY as the control for whether debugging messages are shown in generated HTML.
If the objective is to log errors without displaying WordPress debugging information to website visitors, use:
define( 'WP_DEBUG_DISPLAY', false );
@ini_set( 'display_errors', 0 );
while keeping the same custom WP_DEBUG_LOG location.
2) Login to your WordPress Admin -> Plugins -> Add Plugins -> Upload Plugin -> select the download, install and Activate
3) Once installed, verified, the agent will run a local scan.
Step 2: Add Domain below -> Create a txt DNS record with the details below -> click Verify Record
1) Log In: Sign in to the dashboard of the domain registrar or hosting provider where you purchased your domain (e.g., GoDaddy, Cloudflare or Any Hosting Provider).
2) Find DNS Settings: Navigate to the DNS Management, DNS Zone Editor, or Advanced DNS settings page.
3) Add Record: Click to add a new record and select TXT (or Text) as the record type.
4) Enter the Details:
– Name/Host: Enter @ to apply the record to your root domain, or input a specific subdomain if instructed by your service provider.
– Value/Content: Paste the exact text string provided by the third-party service.
– TTL (Time to Live): Leave this at the default setting (often 1 hour or 3600 seconds) unless the service requested otherwise.
5) Save: Save your changes. Keep in mind that DNS updates can take anywhere from a few minutes up to 48 hours to fully propagate globally.
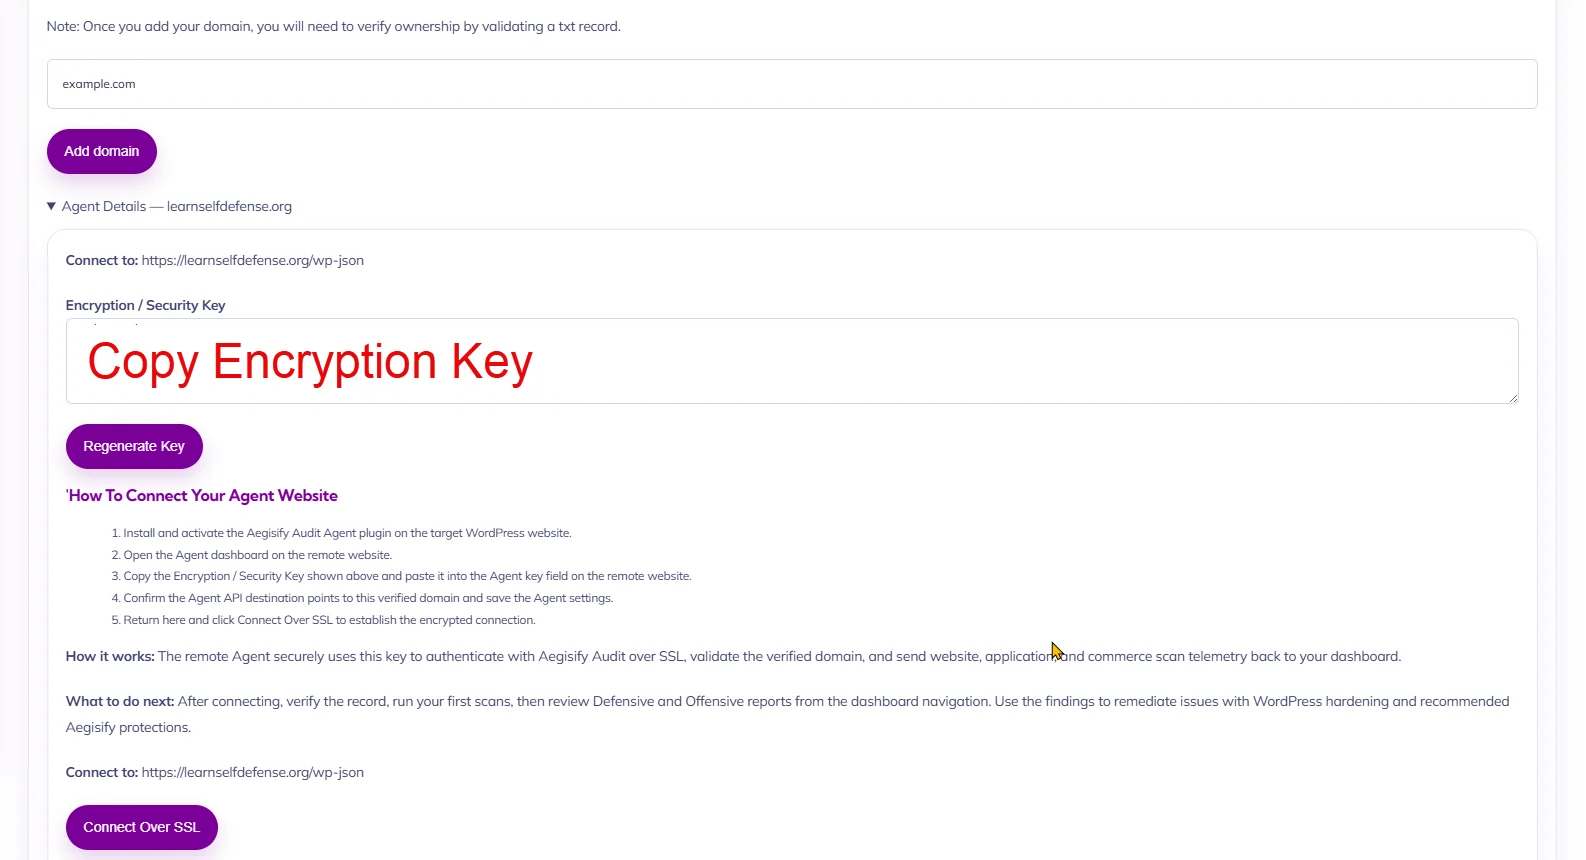
Step 3: From SaaS Domain Settings page, click to expand “Agent Details” below, copy the generated Encryption / Security Key
Step 4: Go back to Destination WordPress Website, In WordPress Admin -> Open “Aegisify Audit Agent” from the left menu and open the Agent -> Paste the Encryption / Security Key. Click the wide blue button “Save Encryption Key”.
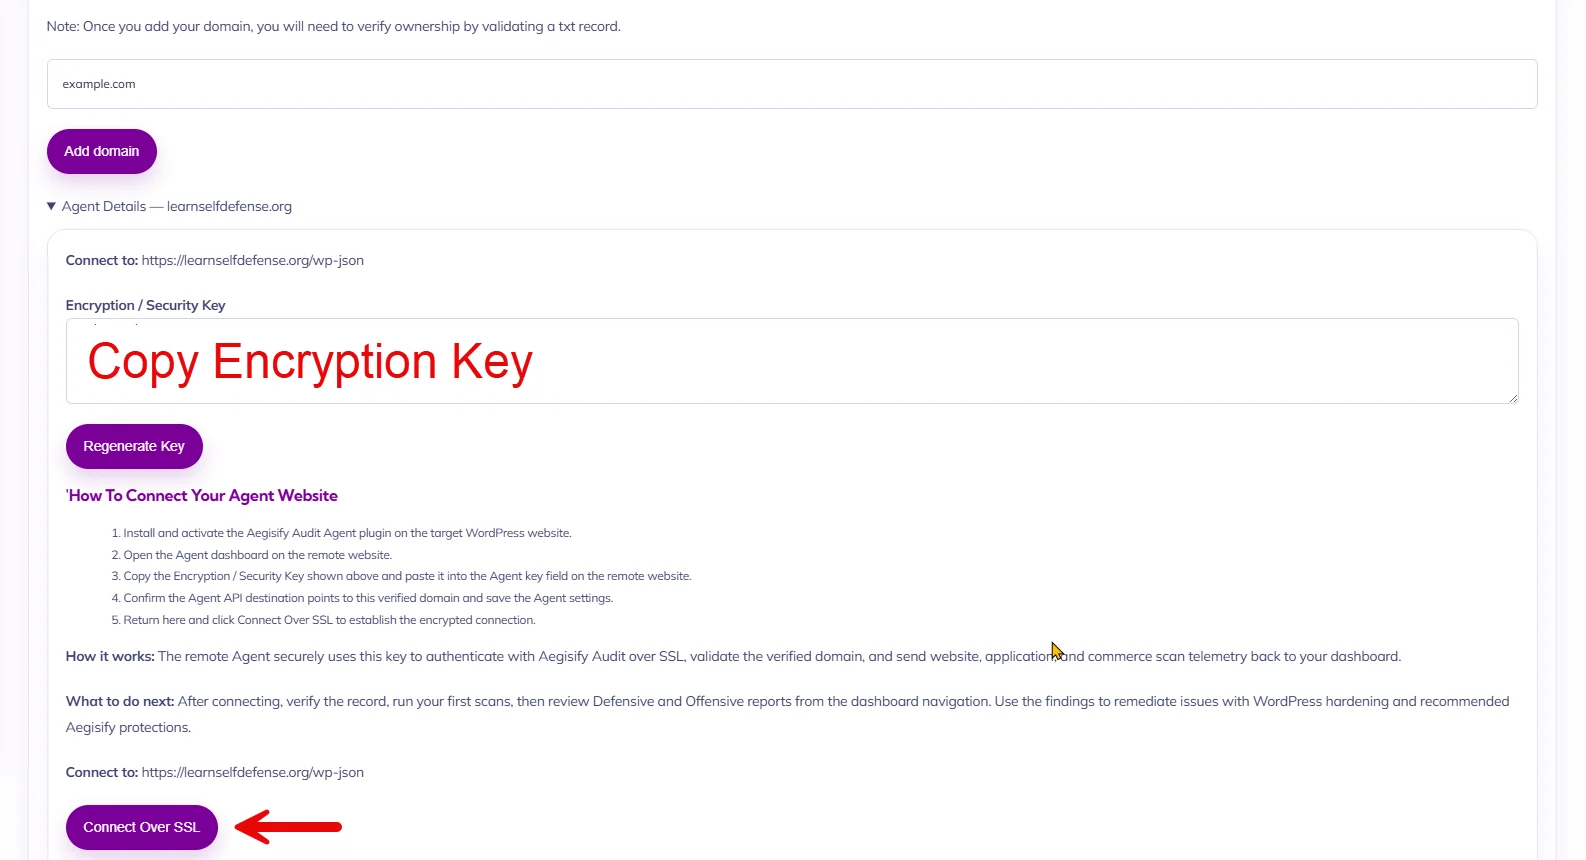
Step 5: Go back to SaaS Domain Settings page, under “Agent Details” below and click on “Connect Over SSL” and view the connectivity logs. It should say Success -> Agent Verified Succeeded.
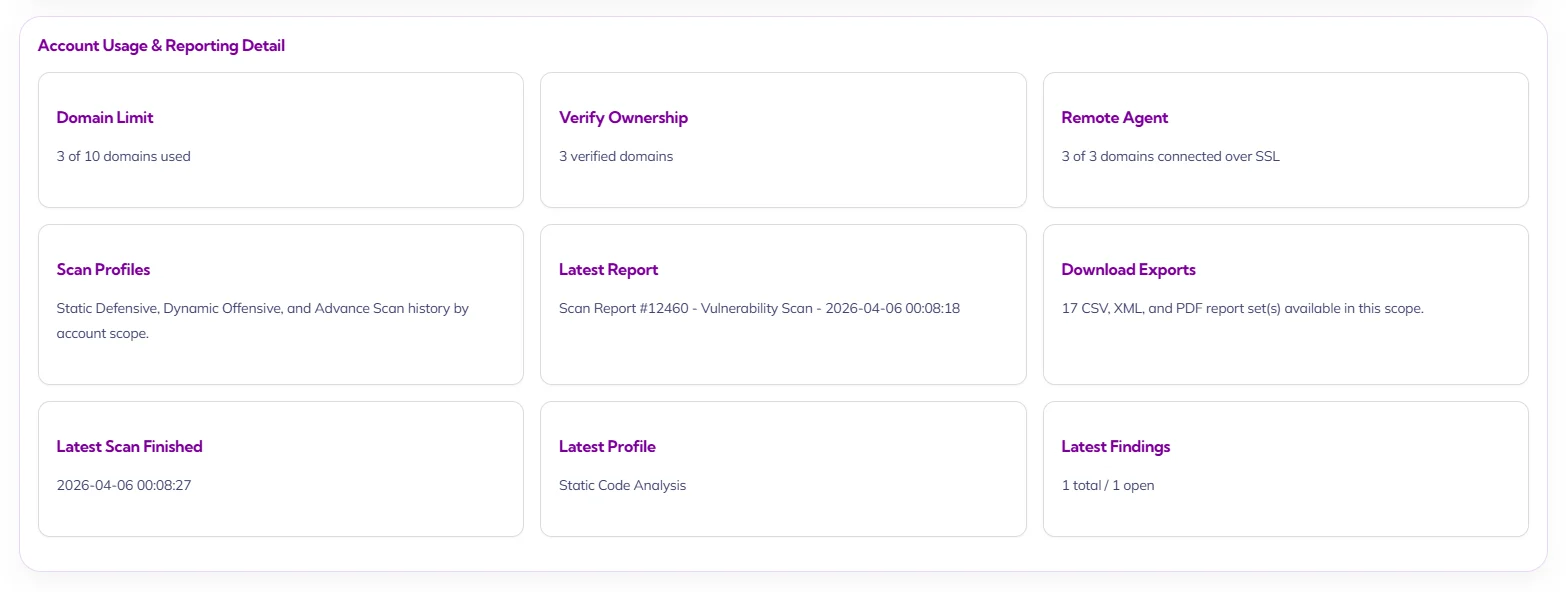
This card provides an operational summary of account consumption, verified asset readiness, reporting state, and latest scan/report activity. It is intended to help administrators, security leads, and program owners understand whether the account is properly configured, actively connected, and producing usable reporting artifacts.
Domain Limit
This subcard summarizes domain consumption against the account’s allowed capacity. It is used to track whether the organization is approaching or exceeding its licensed target limit.
Verify Ownership
This subcard reports how many domains have completed ownership validation. It is an important governance indicator because verified ownership is foundational to authorized scanning and reporting.
Remote Agent
This subcard reports how many verified domains currently maintain active remote agent connectivity. It indicates whether deeper defensive and log-based features are operational across the expected target set.
Scan Profiles
This subcard summarizes scan history across the major scan families within the account scope. It provides a concise view of which assessment tracks are contributing data to the dashboard.
Latest Report
This subcard identifies the most recently generated report in the current scope. It gives the user a direct reference point for the latest formal reporting artifact available.
Download Exports
This subcard reports how many downloadable export files are currently available in scope. It is a practical indicator of reporting volume and artifact readiness for distribution or retention.
Latest Scan Finished
This subcard records when the most recent scan completed. It helps the user assess how current the visible posture and reporting state are.
Latest Profile
This subcard identifies the most recent scan profile completed in scope. It provides clarity on what type of assessment most recently informed the dashboard.
Latest Findings
This subcard reports the current count of findings tied to the latest scan state. It is intended to give a compact indication of whether the latest completed assessment surfaced unresolved issues.
The Compliance Insights card is the comparative control-gap view for the selected scope. It translates compliance findings into operationally meaningful analysis so leadership and technical teams can understand where the environment is diverging from expected baseline, what changed recently, and where remediation should be prioritized.
AI Compliance Analysis
This subcard provides an AI-generated interpretation of compliance posture, recent control regressions, and remediation direction. It is intended to convert raw control observations into a prioritized narrative that is useful for both governance and engineering audiences.
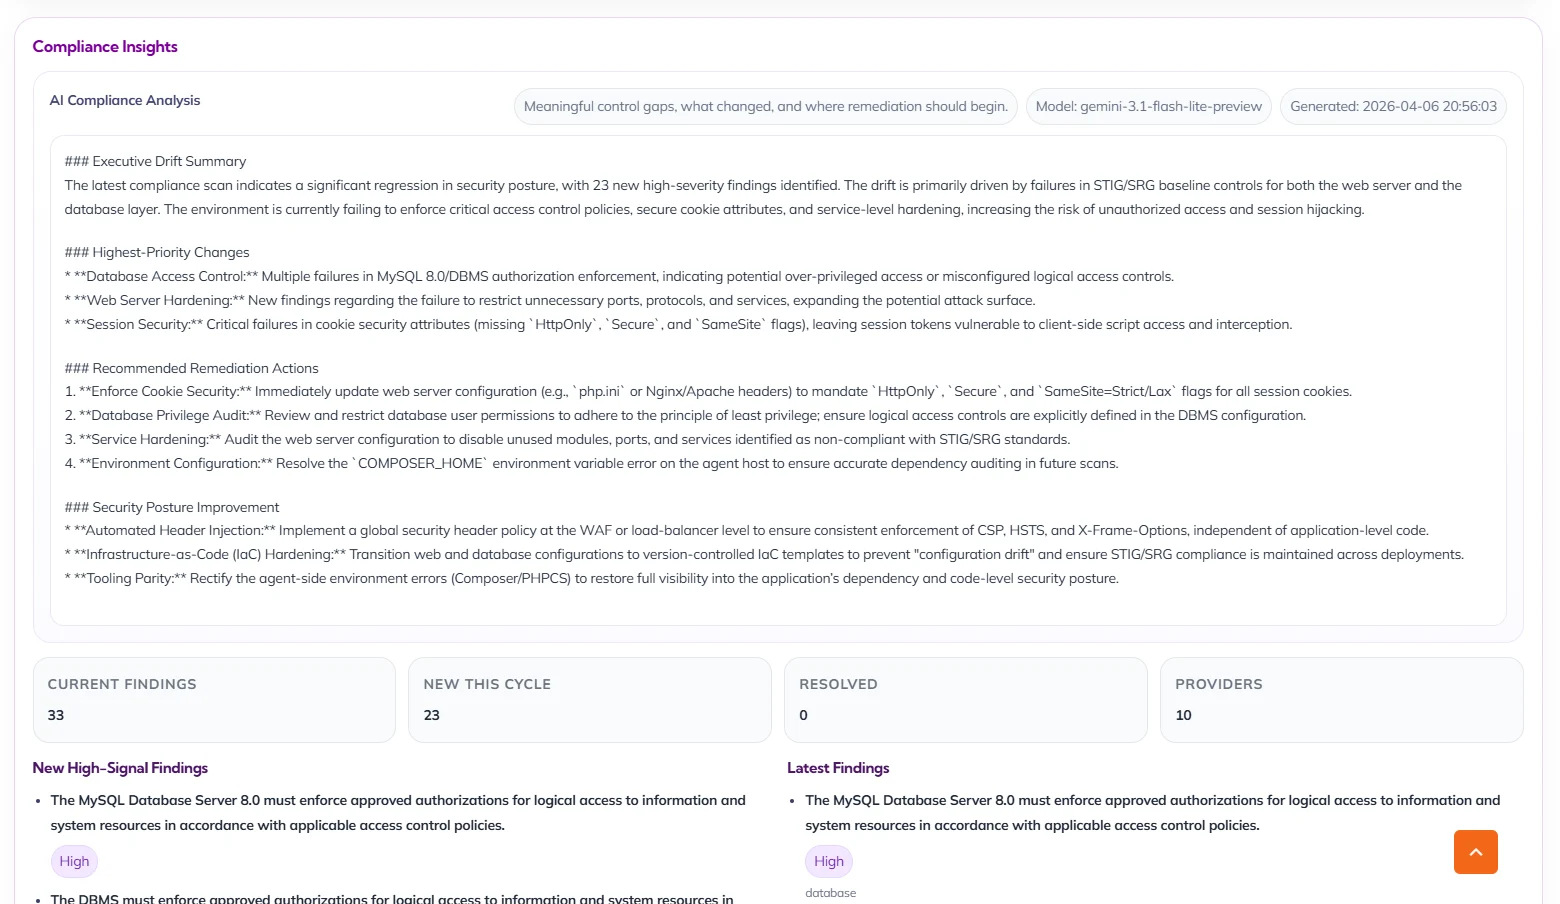
Current Findings
This subcard reports the total number of compliance findings currently present in scope. It provides a concise measure of control deviation at the present point in time.
New This Cycle
This subcard reports how many compliance findings were introduced in the latest cycle. It is important for identifying whether the control posture is deteriorating.
Resolved
This subcard reports how many compliance findings were cleared since the prior comparison point. It reflects whether remediation activity is improving the control environment.
Providers
This subcard reports how many control or evidence providers contributed to the current compliance view. It indicates the breadth of supporting input behind the result set.
New High-Signal Findings
This section highlights newly introduced compliance observations that have the greatest operational or governance significance. It is designed to direct attention to the issues most likely to affect policy, audit readiness, or platform assurance.
Latest Findings
This section presents the most recent significant compliance observations now present in the environment. It helps the user quickly understand what is currently driving the compliance posture.
The Vulnerability Insights card is the executive and technical view for known vulnerability exposure in the selected scope. It is designed to show whether vulnerability risk is changing, whether dependency exposure is being introduced, and whether any high-priority intelligence such as KEV alignment is present.
AI Vulnerability Analysis
This subcard provides an AI-generated interpretation of the vulnerability state, including operational blockers, coverage gaps, and remediation priorities. It is intended to help users distinguish between true vulnerability movement and scan execution problems.
Known Vulnerabilities
This subcard reports the number of known vulnerabilities currently present in the selected scope. It provides the clearest high-level count of recognized software exposure.
Dependency Risks
This subcard reports the number of identified dependency-related risks affecting the environment. It is used to summarize software supply chain exposure at a glance.
Dependency Risks
This subcard reports whether any vulnerabilities align to known exploited vulnerability intelligence. It is a prioritization signal intended for rapid risk escalation where exploitation relevance is known.
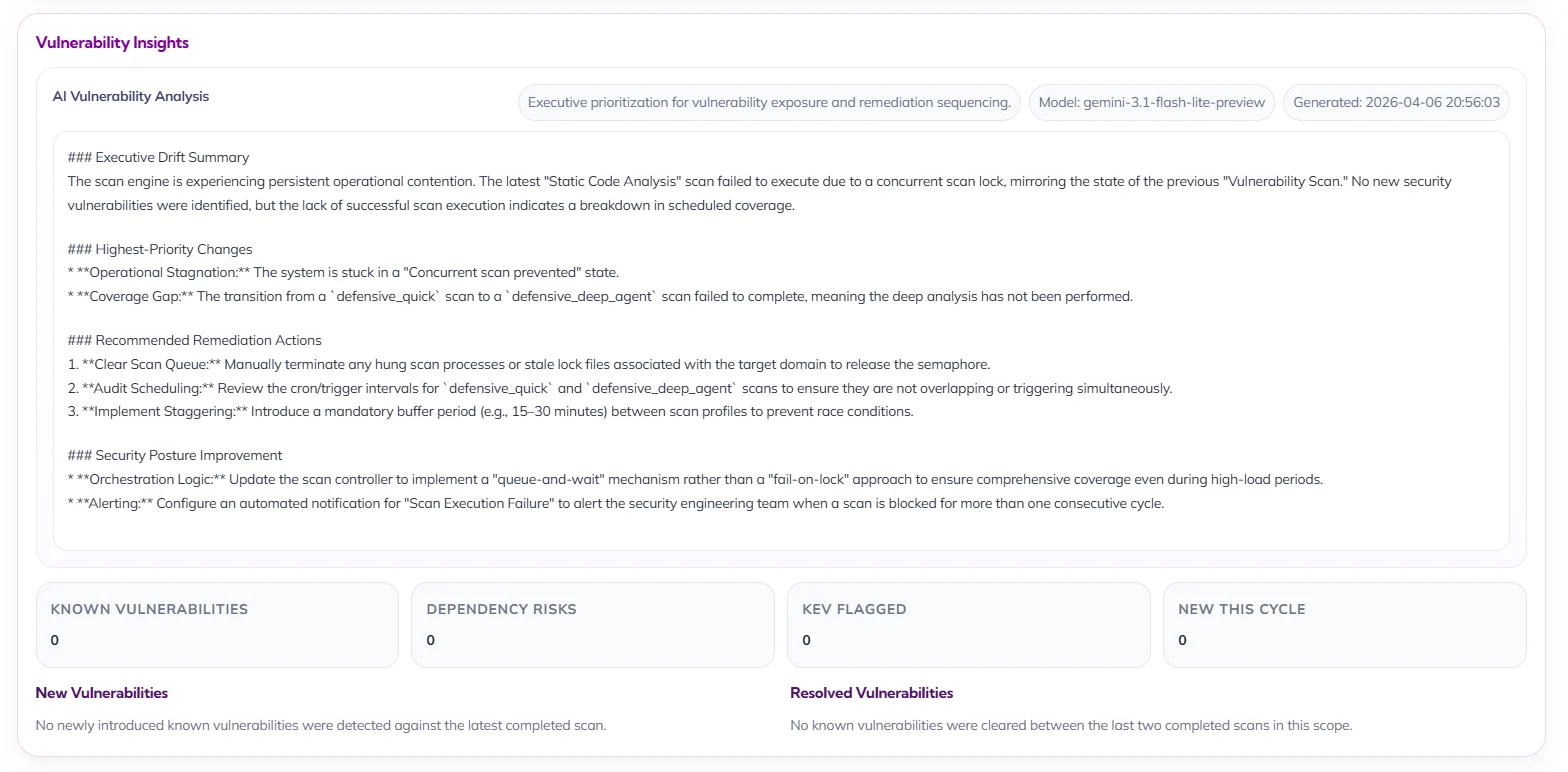
New This Cycle
This subcard reports how many new vulnerability items were introduced in the latest comparison cycle. It helps determine whether exposure is actively increasing.
New Vulnerabilities
This section explains whether the current cycle introduced any newly identified vulnerabilities. It provides narrative context behind the numeric summary.
Resolved Vulnerabilities
This section explains whether any previously identified vulnerabilities were cleared between the last two comparable scans. It is intended to show measurable remediation progress.
This card is the executive delta view between comparable scans. It focuses specifically on change in the highest-priority finding tier so decision-makers can determine whether risk is newly emerging, being reduced, or simply persisting over time.
New Critical + High
This section provides the headline interpretation of the current security state. It is designed to communicate whether posture is stable, improving, or degrading, and whether any immediate executive concern exists.
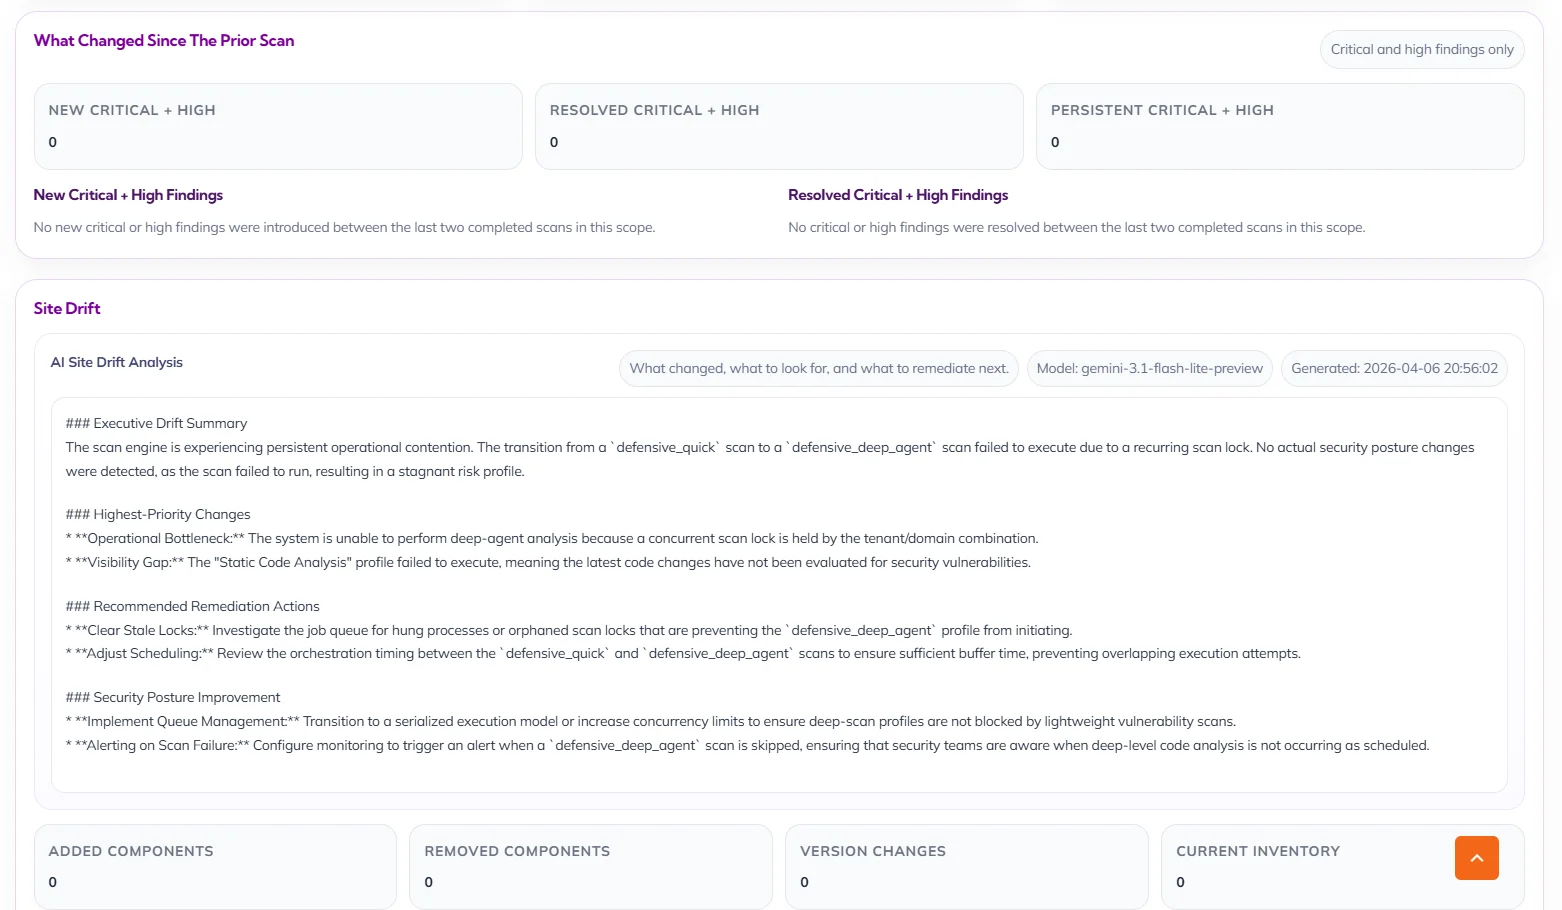
Site Drift
The Site Drift card is the operational change-analysis view for the selected domain. It is intended to explain how site composition, inventory, and environment movement may have changed since the prior scan, and to provide AI-assisted interpretation of what those changes mean for security and stability.
AI Site Drift Analysis
This subcard provides an AI-generated interpretation of what changed, what should be reviewed, and where remediation or validation should begin. It is designed to turn raw drift signals into a structured operational assessment.
Added Components
This subcard reports newly observed components or assets since the prior comparison point. It helps teams detect expansion of inventory, newly deployed functionality, or fresh attack surface.
Removed Components
This subcard reports components or assets no longer observed in the current cycle. It is useful for tracking decommissioning, rollback, or potential visibility gaps.
Version Changes
This subcard reports components whose version state changed between scans. It is especially important for patch validation, regression tracking, and change-control review.
Current Inventory
This subcard reflects the currently observed component inventory for the selected scope. It serves as the present-state baseline for drift comparison and exposure review.
The AI Summary card is the executive narrative layer of the dashboard. It translates posture, findings, scan history, and operational conditions into a structured summary that can be consumed by leadership, security management, architects, and engineers without requiring them to manually interpret every underlying metric.
Executive Summary
This section provides the headline interpretation of the current security state. It is designed to communicate whether posture is stable, improving, or degrading, and whether any immediate executive concern exists.
Security Posture Summary
This section presents the core operating indicators behind the AI narrative, including posture score, overall risk level, and open findings. It serves as the factual anchor for the broader executive interpretation.
Drift And What Changed
This section explains whether meaningful environmental or finding-level change has occurred since the prior assessment. It helps the reader understand whether the current posture reflects stability, regression, or operational disruption.
Priority Recommendations
This section provides immediate next-step guidance based on the current state. It is intended to direct engineering and security teams toward the most important operational or remediation action rather than offering generic advice.
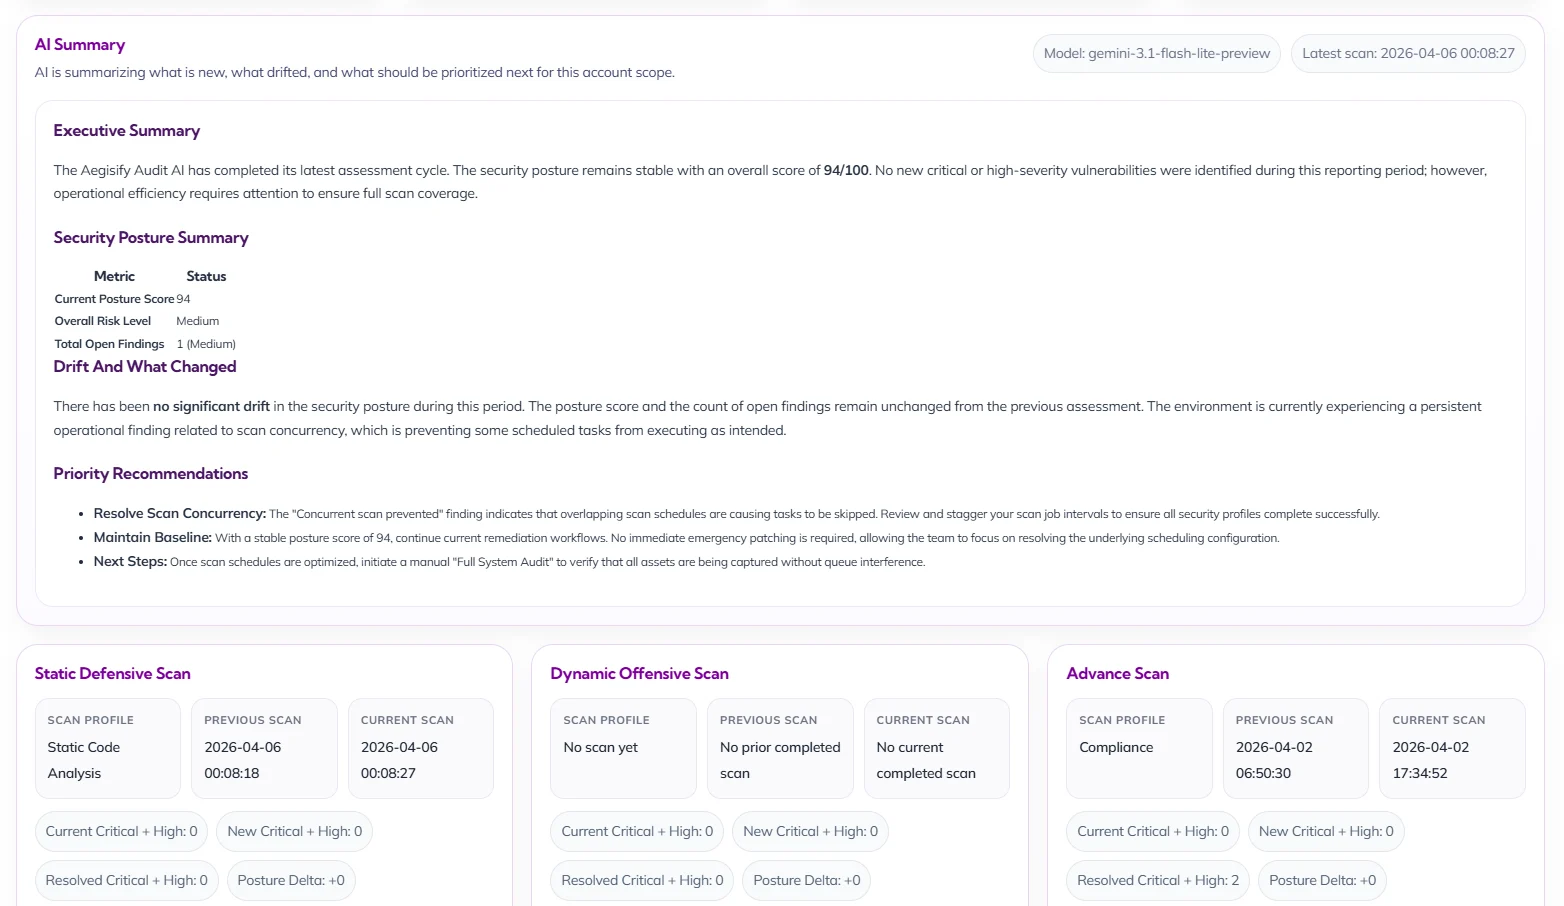
Static Defensive Scan
This card summarizes the current state of the defensive scan family for the selected scope. It compares historical and current execution, surfaces the latest profile in use, and provides a concise delta view so defensive posture can be reviewed quickly.
Scan Profile
This subcard identifies the defensive profile most relevant to the current comparison. It tells the user what type of defensive analysis is informing the displayed posture and trend.
Previous Scan
This subcard records the prior completed defensive scan used as the comparison baseline. It is important for understanding the time reference behind drift and delta calculations.
Current Scan
This subcard records the most recent completed defensive scan in scope. It establishes the latest point of reference for posture and findings interpretation.
Current Critical + High
This subcard shows the number of currently open top-severity defensive findings. It is the fastest measure of whether the latest defensive state includes urgent unresolved issues.
New Critical + High
This subcard shows how many top-severity defensive findings were introduced in the latest cycle. It helps determine whether new risk has emerged rather than simply persisted.
Resolved Critical + High
This subcard shows how many top-severity defensive findings were cleared between the prior and current cycles. It indicates whether remediation activity is materially reducing risk.
Posture Delta
This subcard shows the directional change in defensive posture between the compared scans. It is intended to convey improvement, regression, or stasis in a single compact metric.
Dynamic Offensive Scan
This card summarizes the state of the offensive scan family for the selected scope. It shows whether standard dynamic testing is actively contributing comparable data and makes gaps in offensive coverage immediately visible.
Scan Profile
This subcard identifies the offensive profile used for comparison when available. It tells the user what category of dynamic assessment is expected to inform the current state.
Previous Scan
This subcard records the last completed offensive scan in the comparison chain. It clarifies whether there is a valid offensive baseline available.
Current Scan
This subcard records the most recent completed offensive scan. It indicates whether the dashboard has current offensive evidence or whether the scope lacks recent runtime assessment.
Current Critical + High
This subcard reports the currently open top-severity offensive findings. It provides a direct view into the highest-signal runtime exposure still present.
New Critical + High
This subcard reports newly introduced top-severity offensive findings in the latest cycle. It helps distinguish fresh runtime exposure from older unresolved issues.
Resolved Critical + High
This subcard reports the number of offensive critical and high issues cleared since the prior cycle. It provides a concise signal of remediation progress in the offensive track.
Posture Delta
This subcard shows whether the offensive scan family has materially improved, regressed, or remained flat since the prior comparison point.
Advance Scan
This card summarizes the advanced scan family for the selected scope. It is intended to capture deeper or specialized assessment activity and present its comparative state in the same executive format used across the platform.
Scan Profile
This subcard identifies the advanced scan profile contributing to the comparison. It clarifies which specialized assessment lens is represented in the card.
Previous Scan
This subcard records the previous completed advanced scan available for comparison. It provides the historical reference for delta and resolution analysis.
Current Scan
This subcard records the current completed advanced scan used in the card. It defines the latest specialized assessment baseline available to the dashboard.
Current Critical + High
This subcard reports how many critical and high findings currently remain open in the advanced scan family.
New Critical + High
This subcard reports how many top-severity advanced findings were introduced in the latest comparison cycle.
Resolved Critical + High
This subcard reports how many advanced critical and high findings were closed between the prior and current scans.
Posture Delta
This subcard shows whether the advanced assessment family has improved, regressed, or remained stable relative to its prior comparison point.
The Main Menu is the primary navigation framework for the Aegisify Audit workspace. It gives the user structured access to executive dashboards, scan operations, domain administration, WordPress log ingestion, AI-assisted intelligence, and account configuration, ensuring that both operational workflows and governance tasks can be reached from a single control surface.
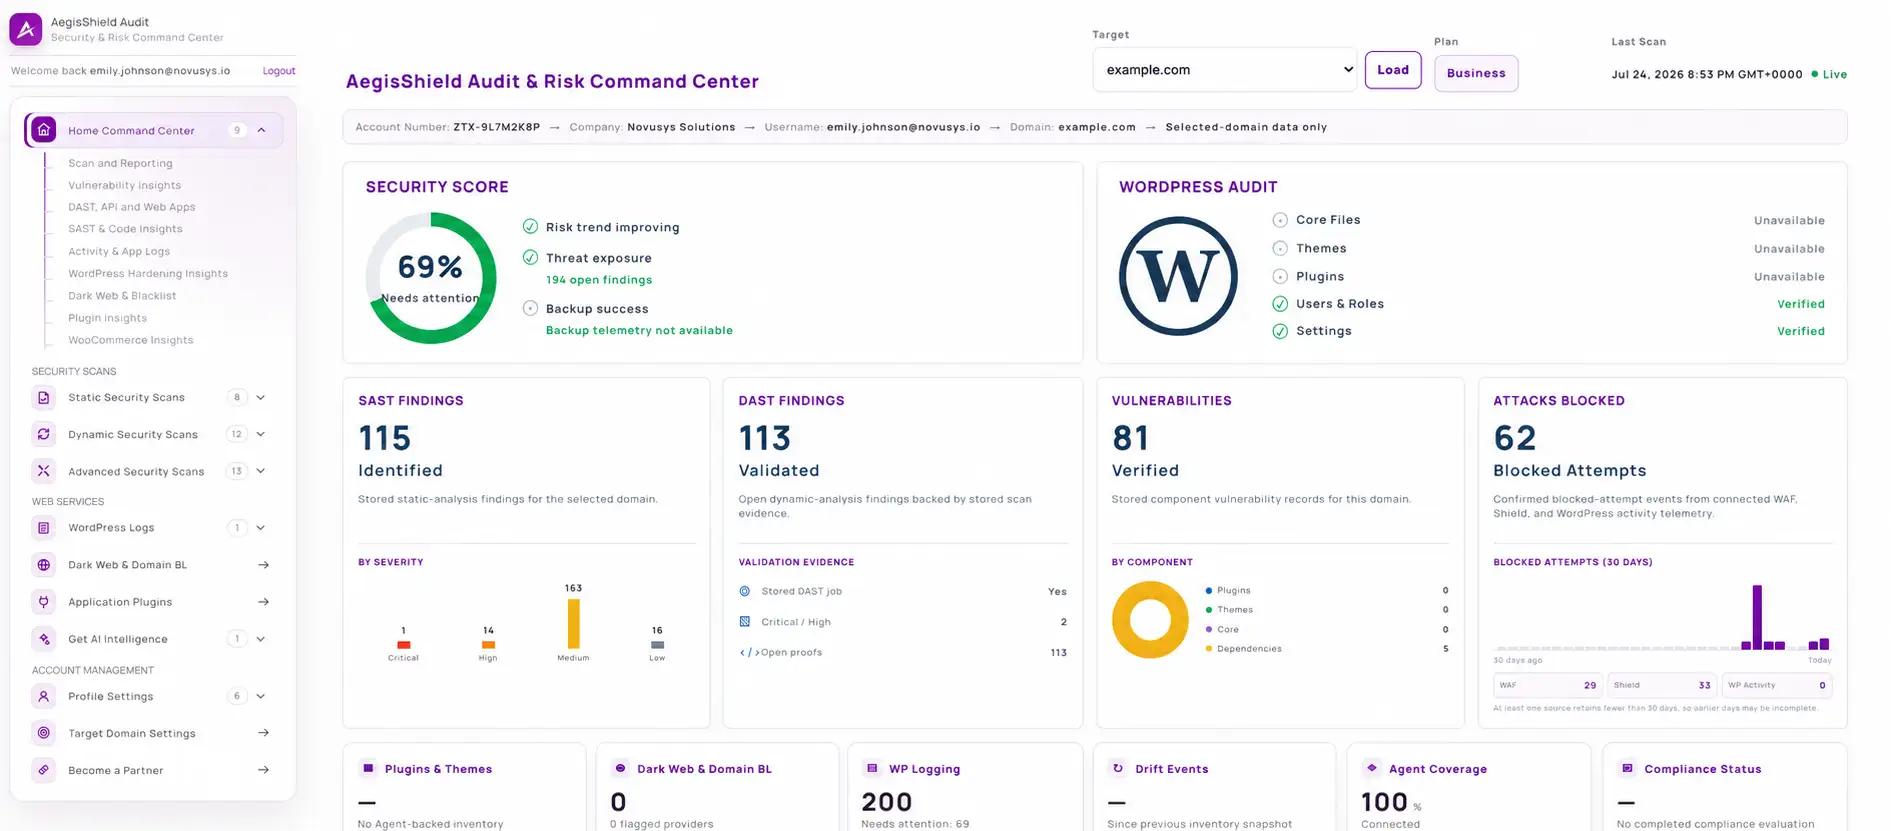
Select Domain
The Select Domain card sets the active scope for the dashboard and all related executive reporting. It ensures that metrics, AI summaries, findings, and account posture indicators are shown in the context of the selected verified asset rather than across unrelated targets.
Account & Security Dashboard
The Select Domain card sets the active scope for the dashboard and all related executive reporting. It ensures that metrics, AI summaries, findings, and account posture indicators are shown in the context of the selected verified asset rather than across unrelated targets.
Plan
The Plan indicator confirms the subscription tier governing feature access, reporting depth, and scan availability. It helps the user understand whether the current experience reflects the licensed operating model.
Analyze Now
The Analyze Now action refreshes the dashboard narrative and comparative reporting for the selected scope. It is the primary control used when the user wants the latest scan-derived interpretation surfaced immediately utilizing Artificial Intelligence.
Account Number
This card identifies the tenant boundary under which all dashboard data is being presented. It is important for governance and multi-tenant clarity because it confirms that metrics, findings, and reports are constrained to the correct organizational account.
Target Domain
This card confirms the active asset scope for the current executive view. It makes clear which domain the current posture, findings, and comparative insights are tied to, reducing ambiguity when multiple targets exist under the same account.
Current Overall Risk
This card presents the current risk state of the selected domain in a simplified executive form. It is intended to summarize the overall level of concern based on the latest completed scan results without requiring the user to interpret raw findings first.
Posture Score
This card provides a weighted security posture score for the selected scope. It offers an at-a-glance indicator of relative strength or deterioration, helping leaders and engineers gauge whether the environment is improving, stable, or regressing over time.
Critical + High Open
This card isolates the highest-priority open issues currently affecting the selected scope. It is designed to surface the clearest signal of present business and technical risk requiring immediate attention.
New Critical + High
This card shows whether new top-severity issues have been introduced since the prior comparable scan. It is intended to help teams distinguish between existing known risk and newly emerging exposure.
New Vulnerabilities
This card highlights newly surfaced known vulnerabilities in the latest scan cycle. It is particularly useful for understanding whether recent changes, component updates, or missed coverage have introduced fresh software risk.
Site Drift
This card summarizes whether the observed site composition has changed between scans. It is a concise indicator of environmental movement that may explain new findings, altered posture, or changed attack surface.
Compliance Findings
This card reports the count of current compliance-related observations within the selected scope. It is intended to quantify control and baseline deviation in a way that is immediately useful for governance and remediation planning.
Completed Scans
This card indicates how many completed scans are available for comparison and reporting. It helps the user understand the depth of available history and whether the environment has enough prior state for meaningful trend analysis.
Verified Domains
This card shows how many domains have been ownership-validated within the account. It supports both governance and operational readiness by confirming how many assets are formally approved for managed assessment.
Connected Agents
This card shows how many verified domains currently have active agent connectivity. It is a readiness indicator for deeper defensive and log-based capabilities that depend on live integration with the target environment.
Whether you are evaluating Aegisify for the first time or managing an active WordPress environment, our team is here to help. We work with website owners, developers, agencies, and organizations that need clearer visibility into WordPress security, risk, privacy, and performance.
Have a question about Aegisify Audit, your account, a technical issue, or how our platform may support your organization? Send us a message, and we will help guide you to the appropriate resource or team member.
Tell Us How We Can Help
Share a few details about your website, question, challenge, or objective so we can better understand your needs. Your message will be directed to the appropriate Aegisify team member for review.
When requesting a callback, include your preferred contact time and time zone, and we will make reasonable efforts to reach you during that window.
What Will Be Reviewed?
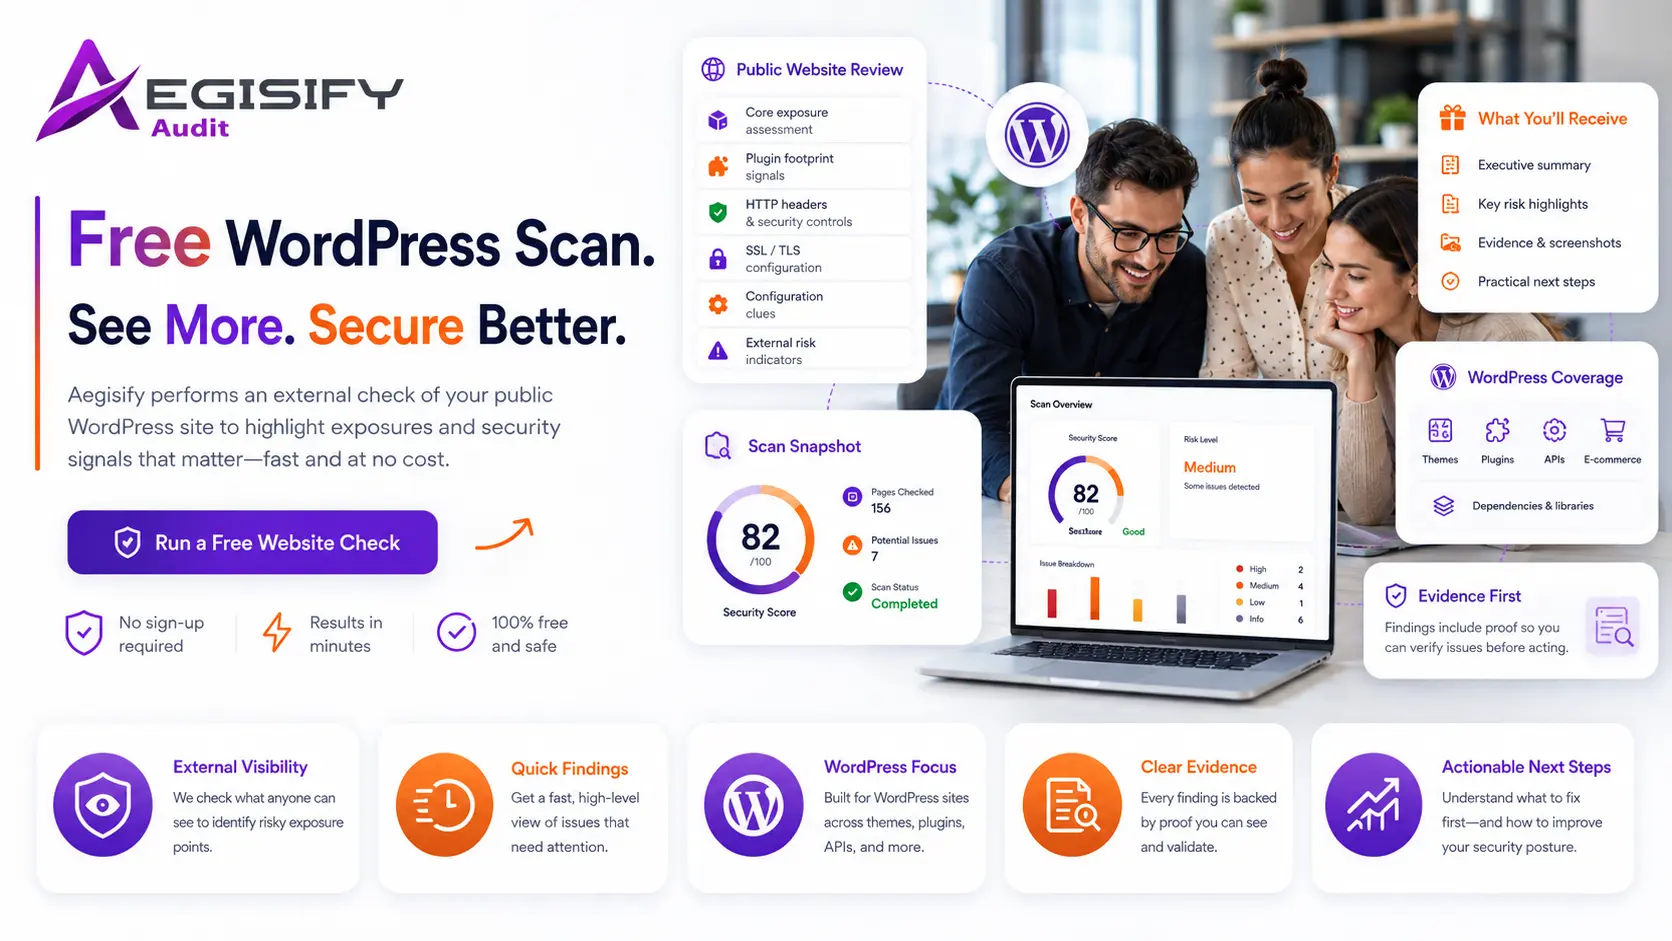
Aegisify begins with the security evidence that can be observed from the public internet. The documented external scan covers 59 website security checks across five primary areas:
- Transport and header posture: HTTPS availability, HTTP-to-HTTPS redirection, browser security headers, cookie attributes, and mixed-content signals.
- Public exposure and sensitive artifacts: WordPress installation files, XML-RPC, debug logs, backup files, database dumps, configuration copies, dependency manifests, environment files, source-control metadata, diagnostic pages, and directory-listing exposure.
- Web and API attack-surface visibility: Public login and administrator boundaries, REST API exposure, user-enumeration signals, GraphQL and OpenAPI endpoints, robots.txt hints, public forms, and WordPress component fingerprints.
- OWASP-style risk indicators: Safe reflected-input and redirect probes, client-side risk patterns, anti-CSRF or nonce indicators, and public authentication or session exposure.
- Public security-readiness signals: A security.txt disclosure contact, a public privacy-notice signal, and limited public indicators relevant to security-control readiness.
The scan reports what was observed. It does not guarantee that every possible vulnerability has been found.
What Does the Documented 59-Check External Scan Mean?
The current Aegisify website states that the Free Test performs 59 external website security checks. In Aegisify Audit 1.2.12, that total can be explained as 29 landing-page, response, active-probe, and public-policy checks plus 30 targeted public path and API probes.
- 29 landing-page and response checks: 2 transport checks, 5 browser security-header checks, 3 cookie-attribute checks, 1 mixed-content check, 7 browser-facing JavaScript pattern checks, 2 POST-form and anti-CSRF checks, 1 generator-metadata check, 3 WordPress component-fingerprint checks, 2 safe active probes, 1 limited public control-signal summary, 1 security.txt check, and 1 public privacy-notice check.
- 30 targeted public probes: WordPress login and administrator paths; readme, XML-RPC, logs, backups, database dumps, installation and configuration artifacts; Composer, Node, Git, and Subversion metadata; WordPress directory-listing paths; PHP diagnostics; robots.txt; REST API and user-enumeration routes; GraphQL; and OpenAPI.
The free public test uses up to 40 lightweight live HTTP touchpoints and a limited runtime. Several checks can be evaluated from the same response, so 59 checks does not mean exactly 59 HTTP requests or exactly 59 findings on every run.
Related controls may also be consolidated into one finding row. The number of surfaced results depends on the website response, the public surfaces that exist, and the scan budget.
What Is External-Only?
The external scan reviews only information available from the public website and its publicly reachable routes. It does not require the Aegisify Agent, WordPress administrator access, saved credentials, or authenticated WordPress telemetry.
External-only evidence can include HTTP response codes, redirects, headers, cookies, public HTML signals, login and administrator entry points, public REST or API routes, exposed files, public WordPress fingerprints, and safe non-destructive probe responses.
An external scan cannot confirm the complete installed plugin and theme inventory, inspect private files, review database configuration, validate internal user privileges, examine local dependency data, or perform full WordPress-side code analysis.
What Requires the Aegisify Agent?
The Aegisify Agent is required when the audit needs authorized evidence from inside the WordPress environment. Depending on the selected scan profile and enabled telemetry, Agent-assisted review can add:
- WordPress core, plugin, theme, must-use plugin, version, activation, update, and software-health inventory.
- Known vulnerability and dependency correlation using the installed software and package evidence available from the site.
- SAST-style code analysis using bundled PHPCS and WordPress Coding Standards coverage, Aegisify WordPress rules, JavaScript checks, and supported Python-assisted rules.
- File, permission, configuration, hardening, integrity, change, administrator, role, capability, scheduled-task, backup, and recovery-readiness evidence.
- WordPress activity events and optional diagnostic logs when the authorized customer enables those telemetry sources.
- Deeper WooCommerce evidence involving checkout, Store API, payments, webhooks, HPOS, Action Scheduler, template overrides, extensions, and internal business-logic context.
Authenticated DAST profiles may also require approved credentials or session material for role-aware and post-login testing.
What Data Is Collected?
For the external scan: Aegisify may process the submitted domain or URL, scan timestamps, HTTP responses, response codes, redirects, headers, cookie signals, public page and route evidence, publicly reachable artifact results, scan findings, and remediation context.
When the Agent is connected: Supported telemetry may include domain and site identity, WordPress environment details, plugin and theme inventory, dependencies, configuration posture, code and file signals, external-exposure correlation, WordPress activity events, optional diagnostic logs, and scan or report data.
Routine Agent-assisted auditing is not designed to collect full WordPress database backups, complete customer content libraries, payment card information, WordPress user passwords, private communications, or unrelated business documents as a normal audit requirement.
Agent activity and diagnostic logs are optional and remain subject to customer-controlled telemetry settings. Customers can deactivate the Agent and remove or rotate the associated security key.
What Will the Buyer Receive?
The free external test provides an on-screen findings report that organizes observed public evidence by severity and category, with the affected path, explanation, supporting evidence, and recommended next step.
The subscribed audit workflow can add broader WordPress and Agent-assisted evidence, risk summaries, finding prioritization, business-impact context, remediation guidance, and report exports in CSV, PDF, and XML formats.
The report structure is designed to help technical and business reviewers understand the assessment scope, what was observed, why the finding may matter, which actions deserve attention first, and what should be retested after approved changes.
How Are SAST, DAST, Dependencies, APIs, and WooCommerce Covered?
- DAST: The external and advanced dynamic profiles make live requests to the running website, inspect real responses, discover public routes and APIs, and use safe canary probes rather than destructive exploitation.
- SAST: Agent-assisted static analysis reviews supported WordPress PHP, JavaScript, and related code signals from inside the authorized site.
- Dependencies: Agent inventory and package evidence can be correlated with vulnerability and software-risk intelligence.
- APIs: Coverage can include REST namespaces, public routes, JavaScript-exposed endpoints, GraphQL, OpenAPI or Swagger definitions, authentication boundaries, authorization signals, and inventory gaps.
- WooCommerce: Public testing can identify externally visible Store API, checkout, payment, webhook, account, cart, coupon, and order surfaces. Agent-assisted review adds internal WooCommerce configuration and compatibility evidence such as HPOS, Action Scheduler, templates, extensions, and payment-related context.
The exact evidence depends on the selected scan profile, the website surfaces that are present, the Agent connection, enabled telemetry, and any approved authentication context.
Why Does Aegisify Lead With Proof Before Feature Volume?
Security buyers should be able to review evidence before relying on a long feature list. Aegisify provides public proof resources that explain the scan boundary, Agent role, telemetry controls, report structure, and available audit depth:
- The documented 59-check external scan
- The sanitized WordPress Security Audit report example
- The Aegisify Security and Trust Center
- Agent telemetry, privacy, and data-handling controls
- The external-versus-Agent-assisted workflow explanation
- The scan-profile and coverage matrix
These resources help buyers understand what is external-only, what requires authorized WordPress access, what technical data may support the audit, and what the final report is designed to provide.
What Is the Single Next Action?
Start with the public external scan. Review the findings first, then decide whether deeper Agent-assisted WordPress evidence is appropriate for your environment.


How can Aegisify AI help?
Ask about Aegisify or WordPress: errors, plugins, security, SEO, compatibility, troubleshooting, comparisons, or launch a free website scan.